Professional assessments
Each player's progression, by area.
Create assessment templates by professional area and define the metrics each discipline needs. Open an assessment record and see the historical progression of its metrics.
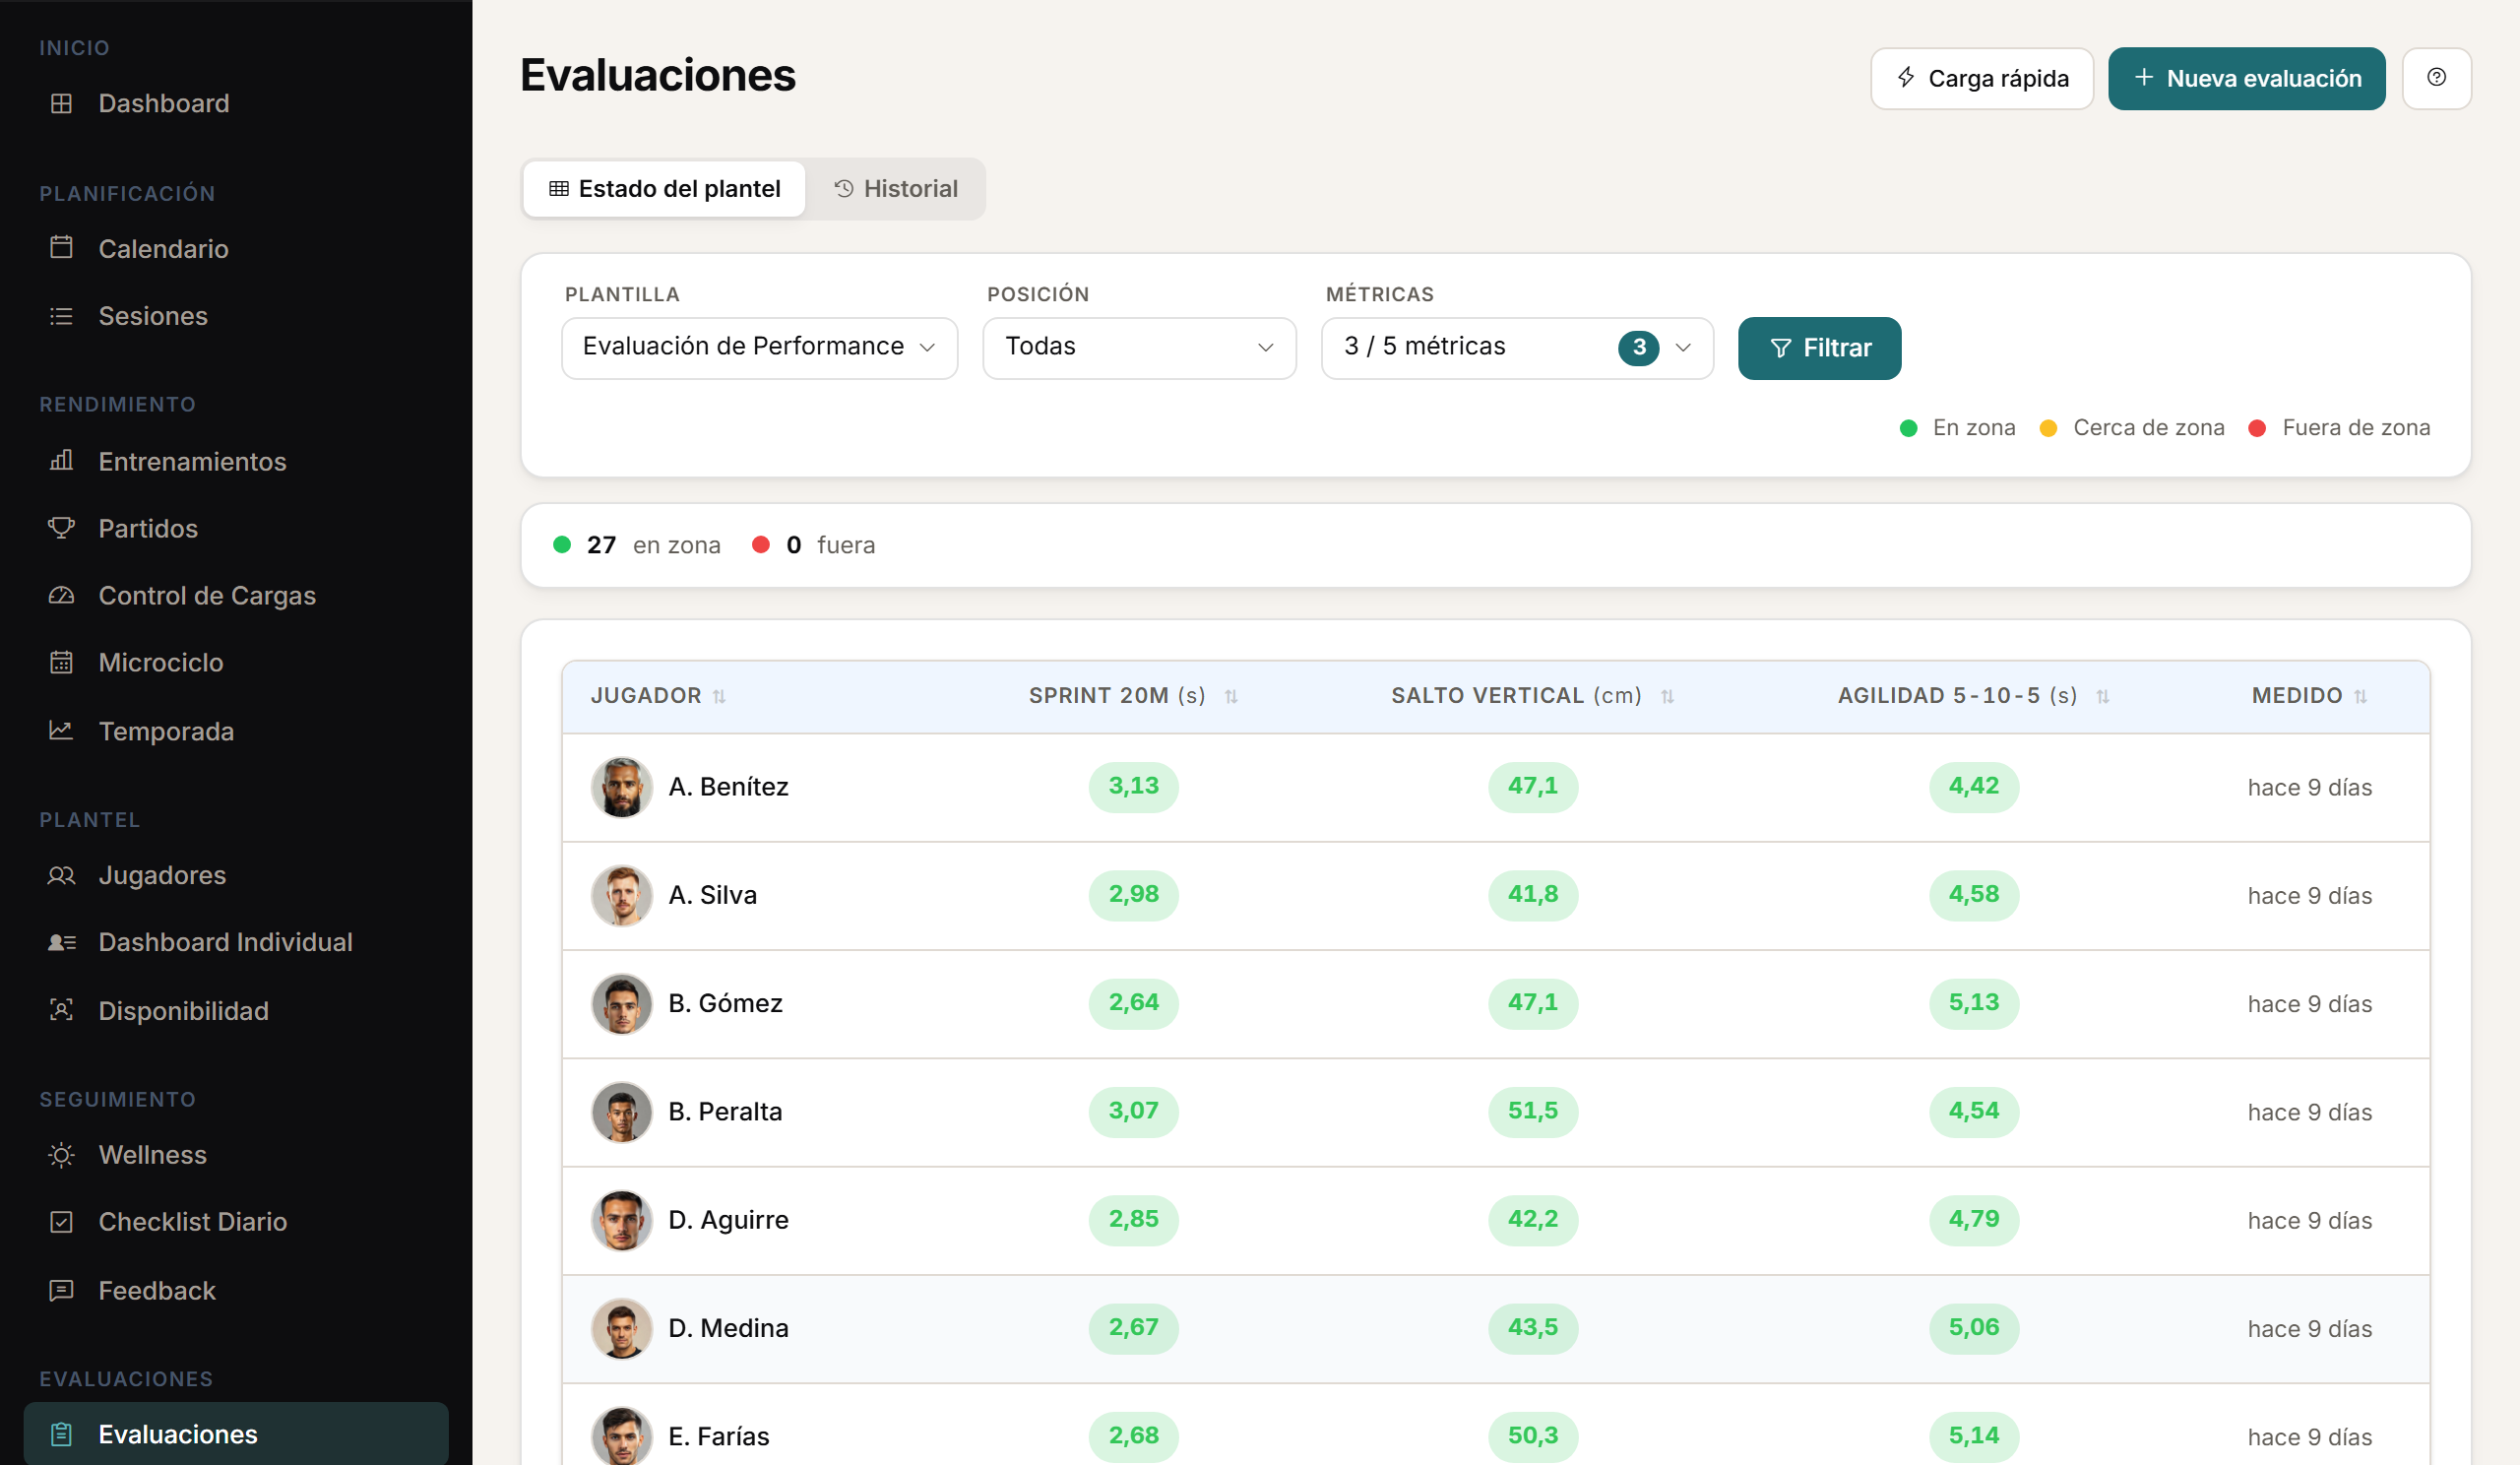
Templates
One template per discipline.
Create assessment templates by professional area and define the metrics each discipline needs. Record individual assessments or enter the whole squad in bulk from the same template.
- Assessment templates by professional area.
- Its own metrics for each discipline.
- Individual or bulk entry from the same template.
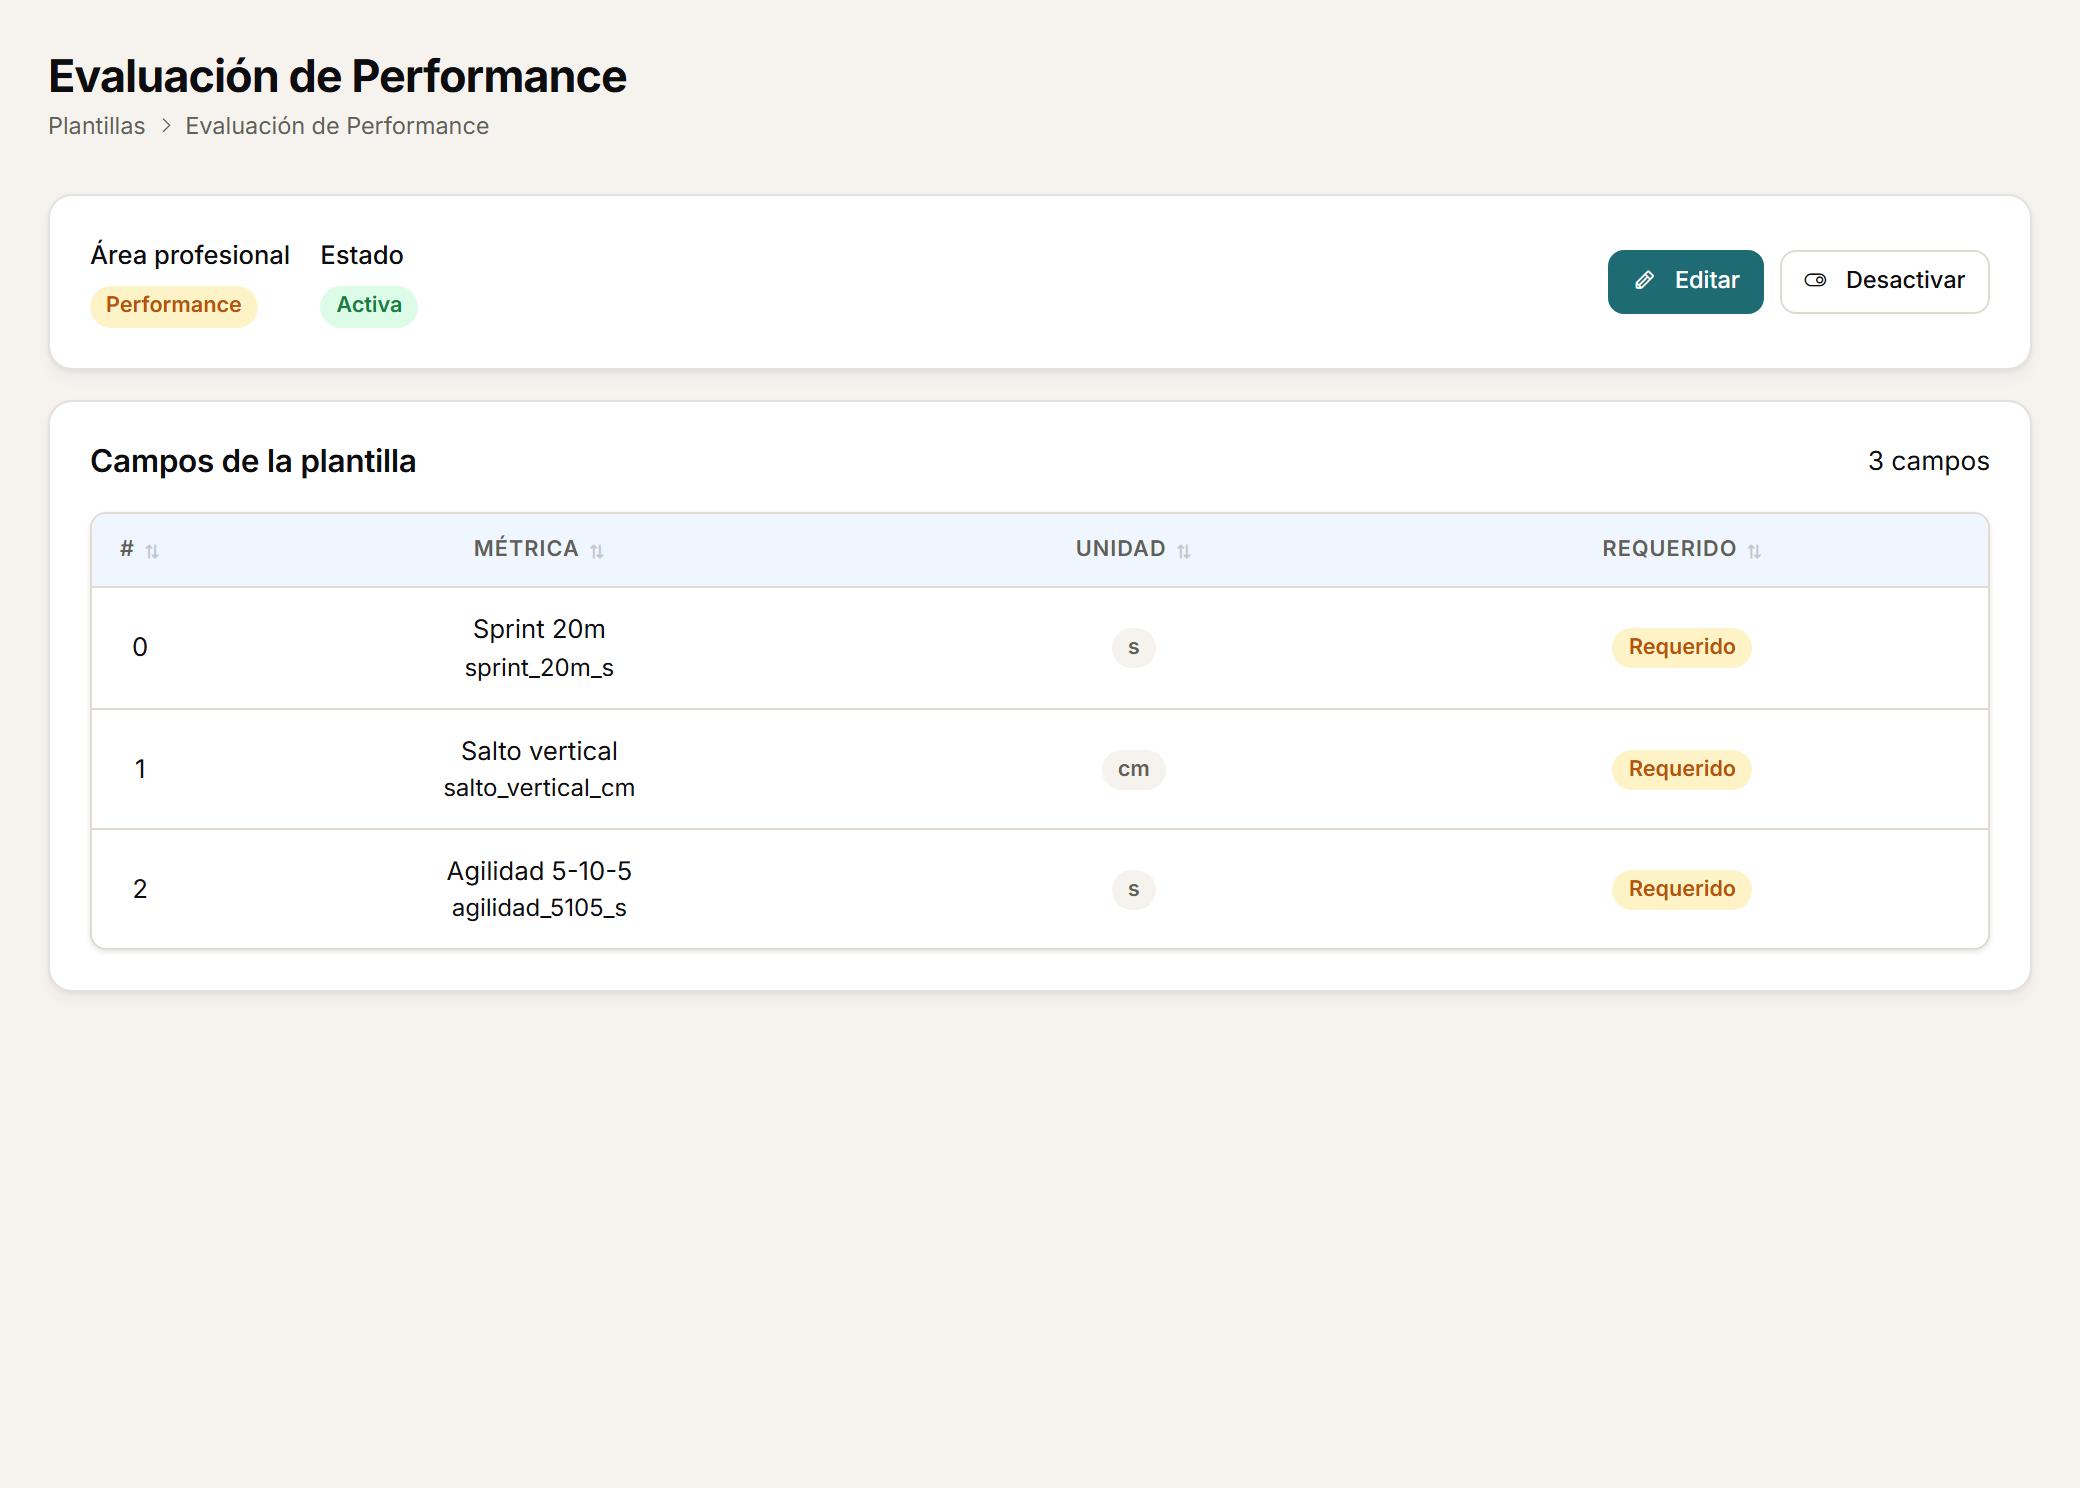
Player record
Every metric's progression.
Open an assessment record and see the historical progression of its metrics.
- A record for every assessment logged.
- Historical progression for every metric.
- Progress visible across successive assessments.
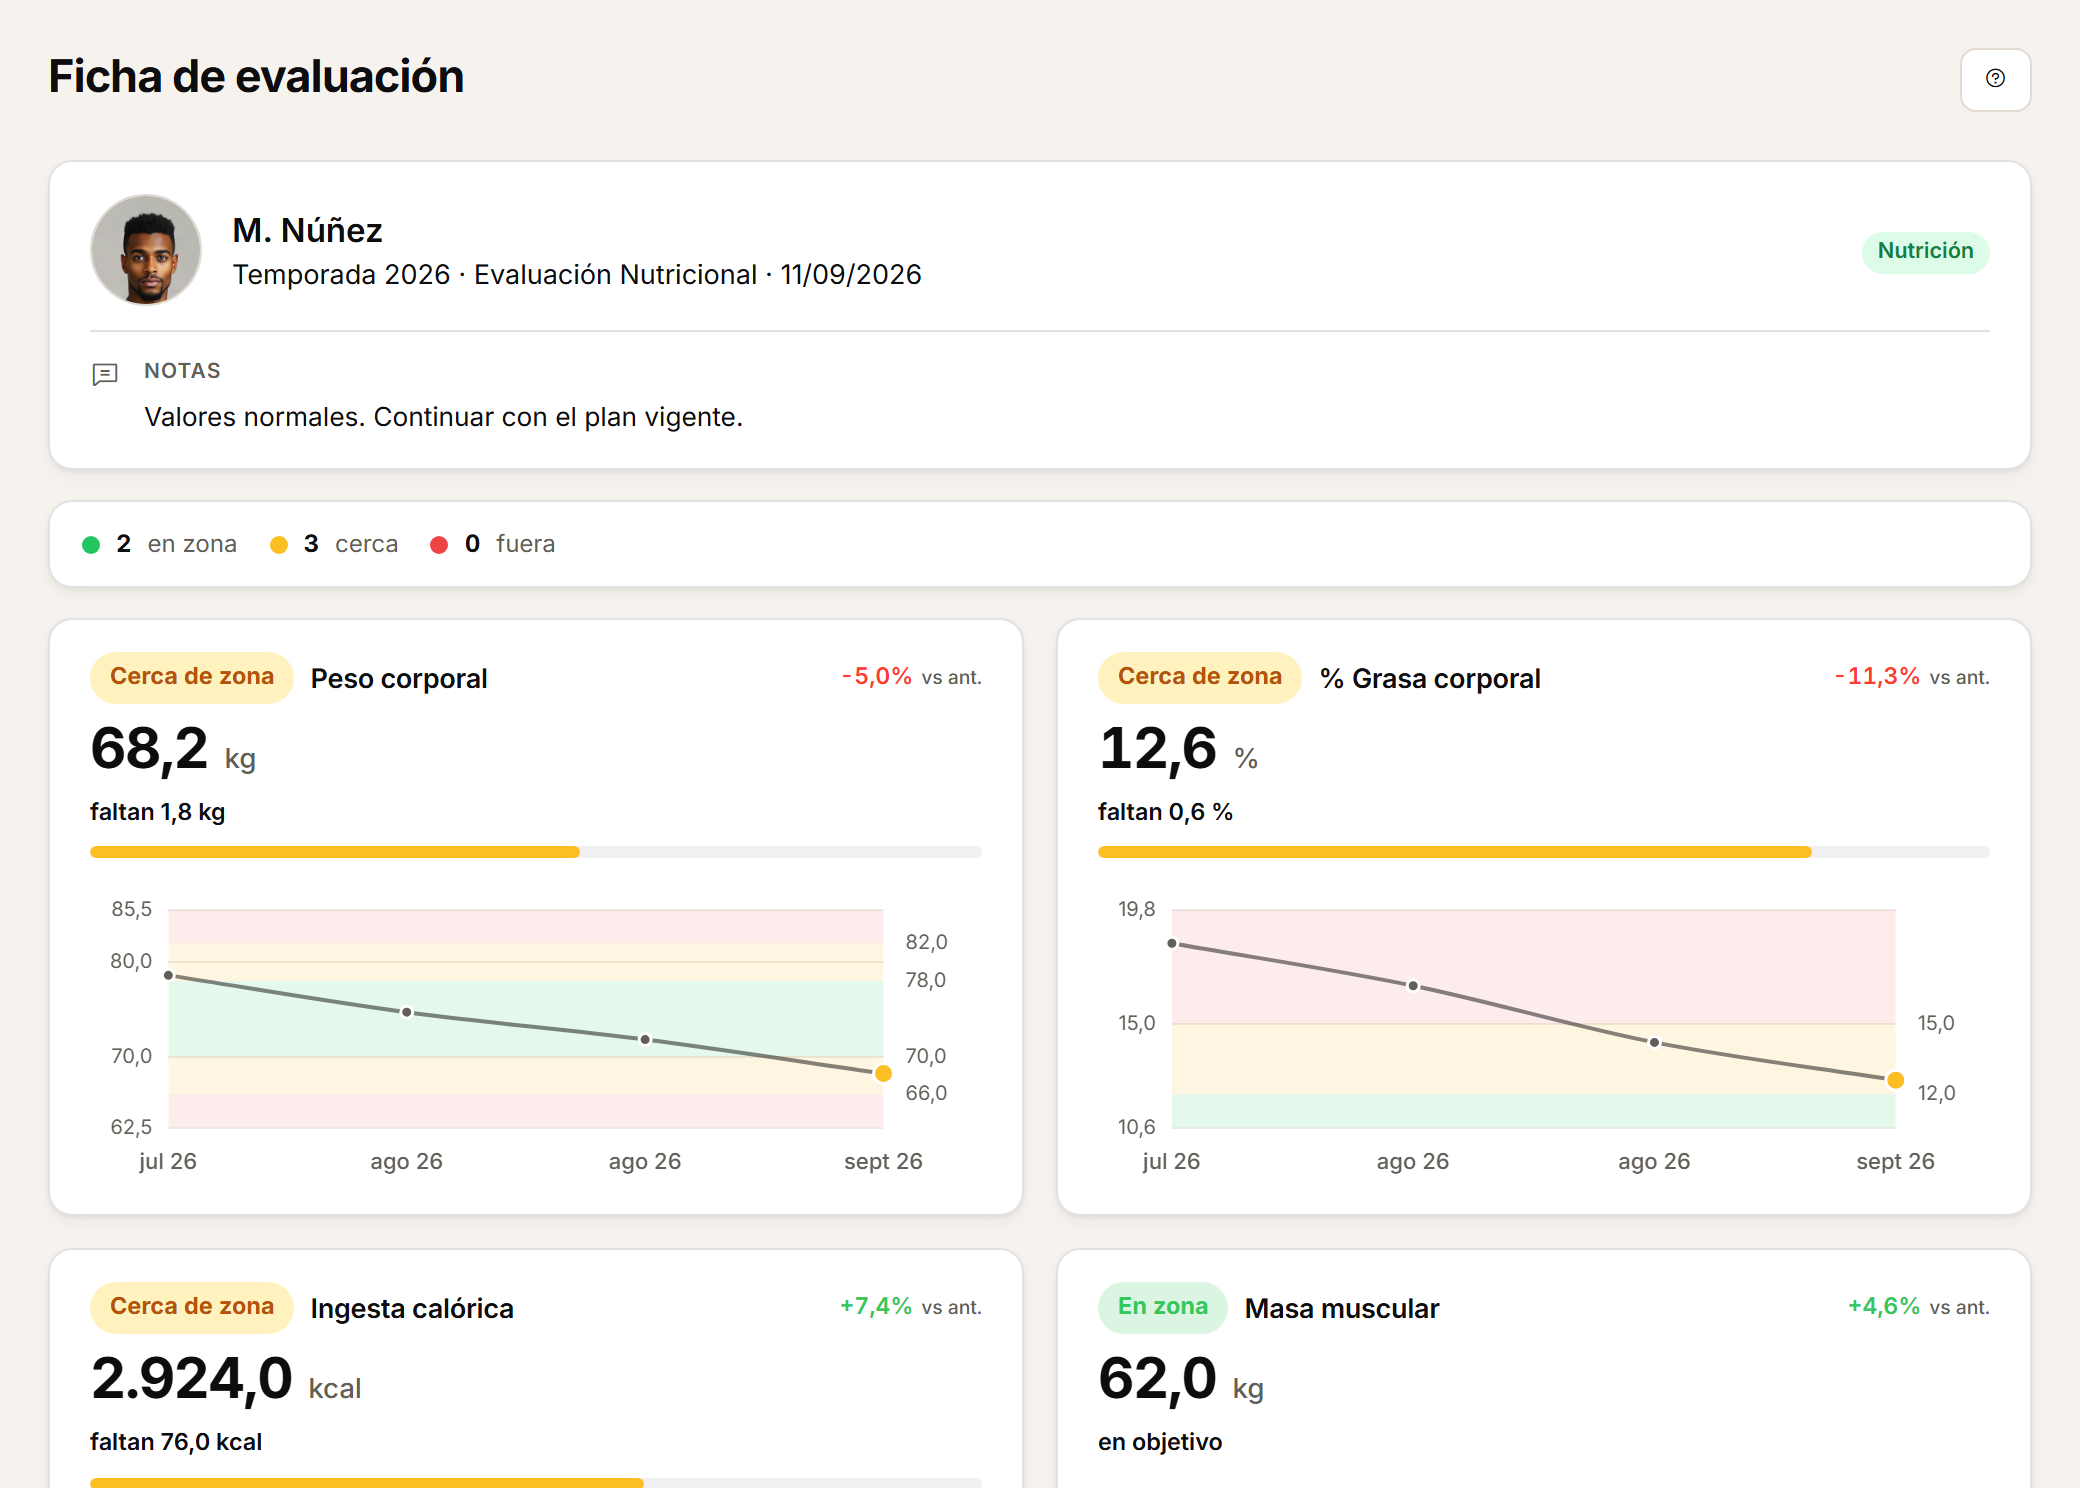
Group reading
The whole squad, at a glance.
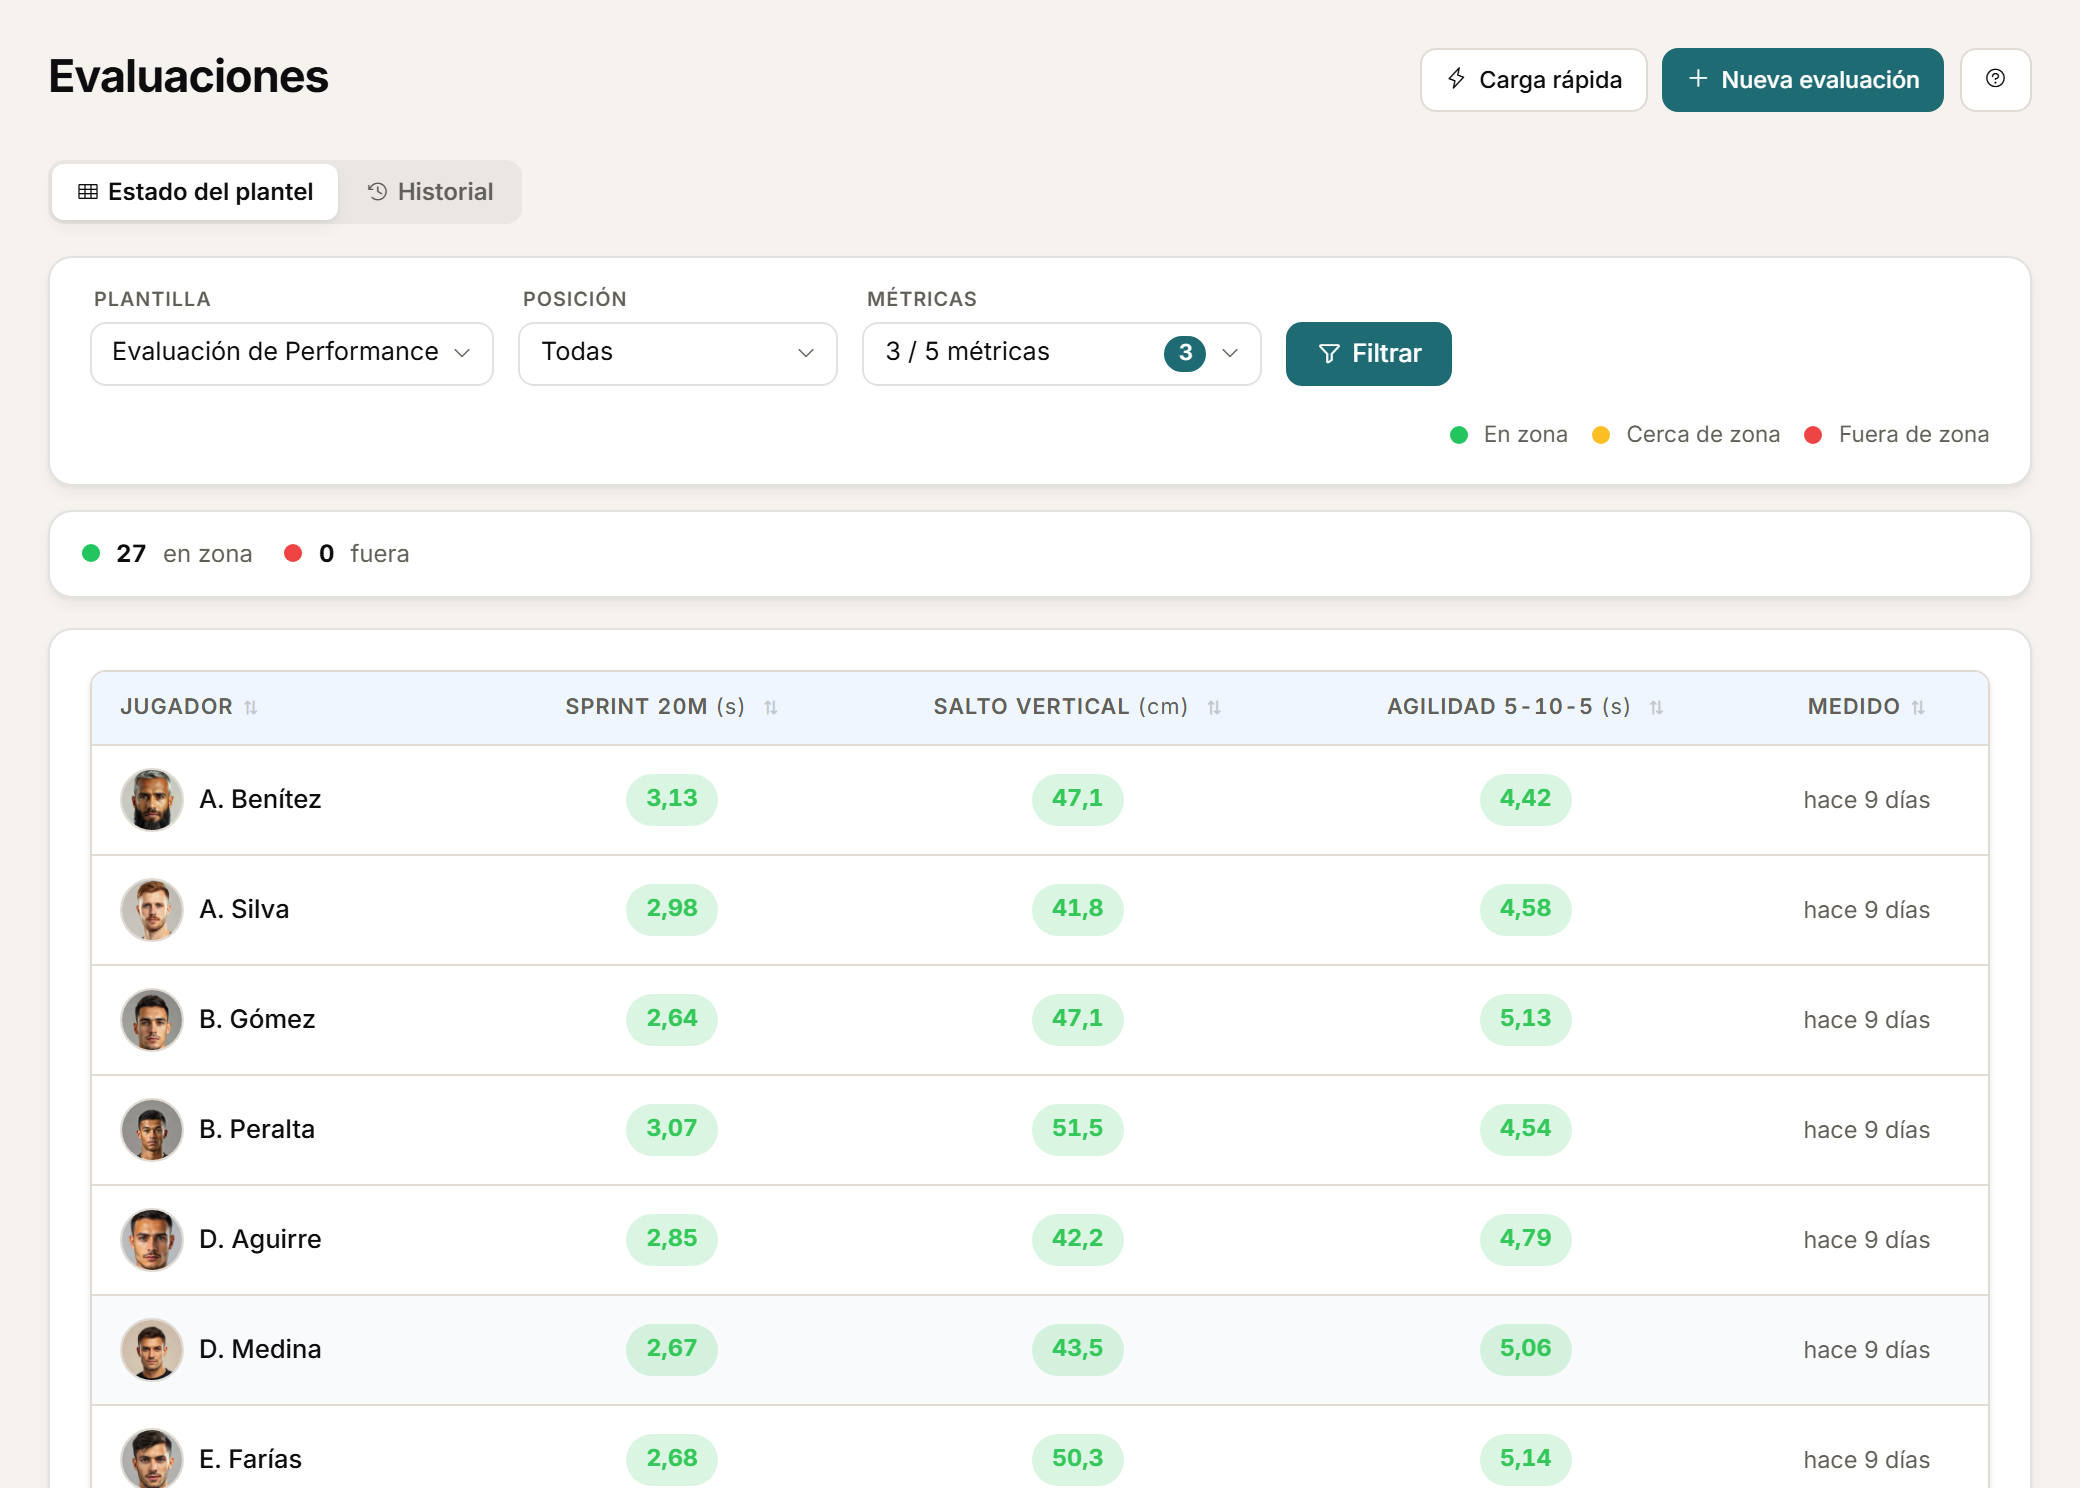
The squad heatmap summarises results by player and metric to make group reading easier.
- Results by player and metric in one view.
- Built for reading the group, not one player.
- A visual comparison between players and metrics.
Access and targets
Configurable zones, staff-set visibility.
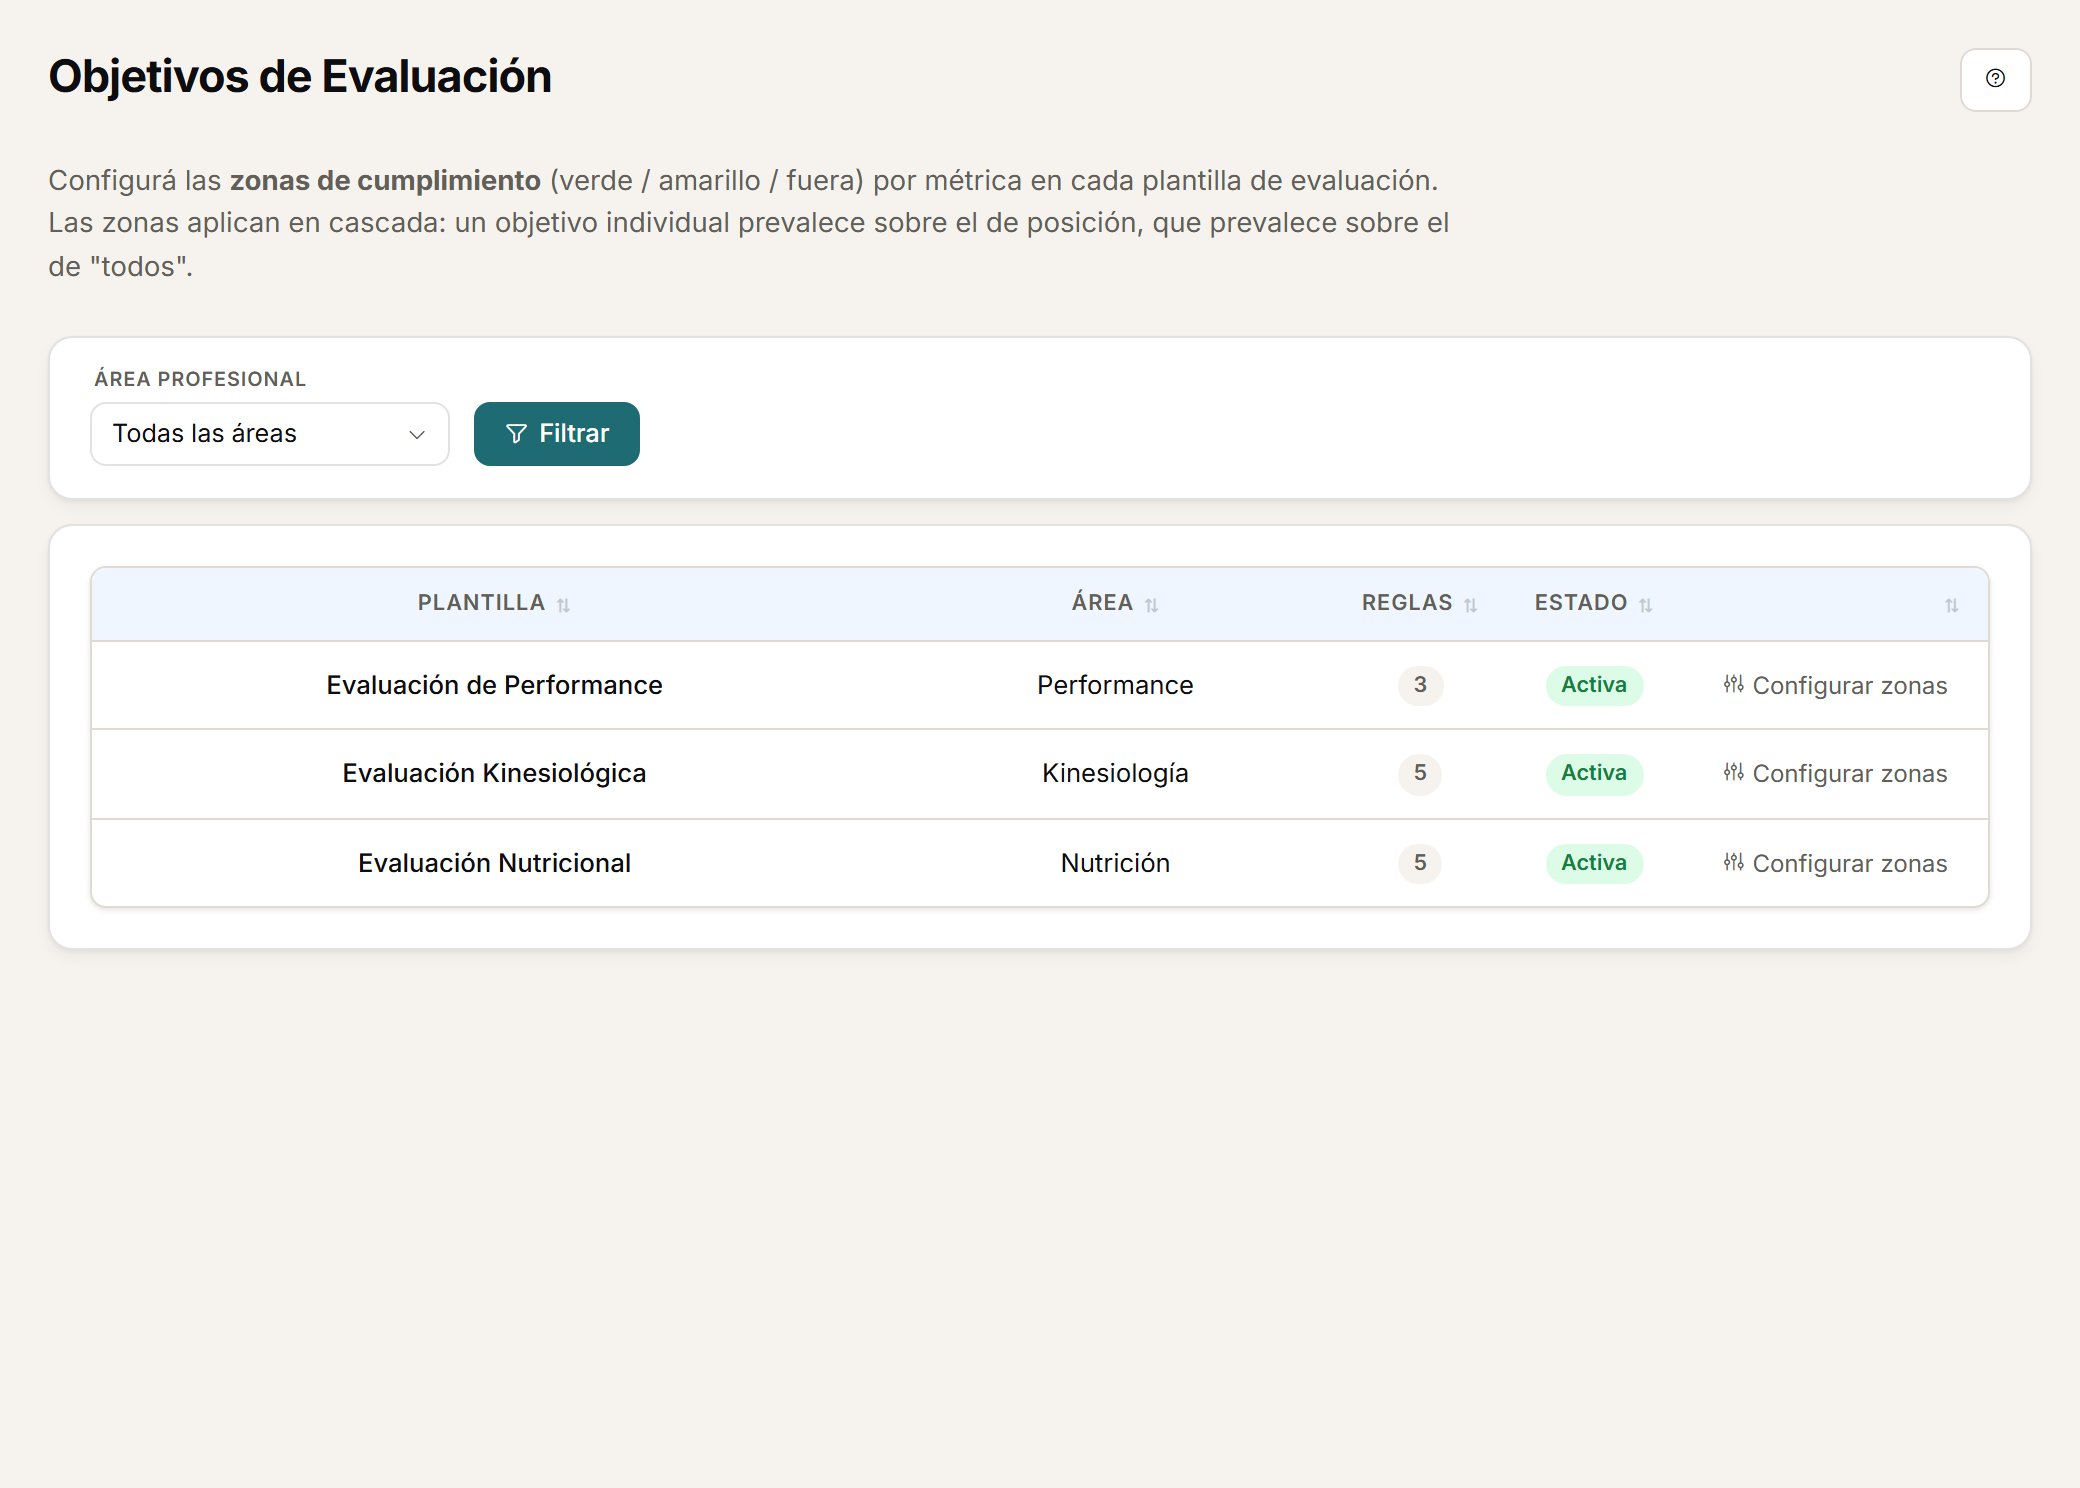
Configure reference zones for assessment metrics and apply them to the scope you define. Staff decide which assessment metrics the player can see in their mobile experience.
- Reference zones for each assessment metric.
- Each zone's scope set to fit the case.
- Player visibility set by staff.
A heatmap is a visual comparison, not a ranking.

Personalised demo
Request a demo with your data.
Send us a CSV exported by your GPS and tell us how you calculate load today. The demo is built on that: your metrics, your thresholds, your microcycle.
Request a demo with your dataOr watch the two-minute tour first
No form needed to see the product. For the demo, an email or a WhatsApp message.
The product interface is currently in Spanish.
What happens next
- 01
You write to us on WhatsApp or email.
Tell us about your club and what you would like to see first.
- 02
We prepare the demo with your data.
We build it on your own GPS CSV and how you calculate load.
- 03
A video call with your staff.
About 45 minutes, with room for every question.